Korali Profiler
Usage
Syntax: python3 -m korali.profiler [--input PROFILING_FILE] [--output OUTPUT_FILE] [--tend END_TIME] [--test]
Where:
--inputspecifies the profiler file to load. By default:profiling.json.
--outputindicates the output file path and type (e.g., eps, png). If not specified, it prints to screen.
--tendindicates time lapse to print. If not specified, it will print the entire execution.
--testverifies that the plotter works, without plotting to screen.
Examples
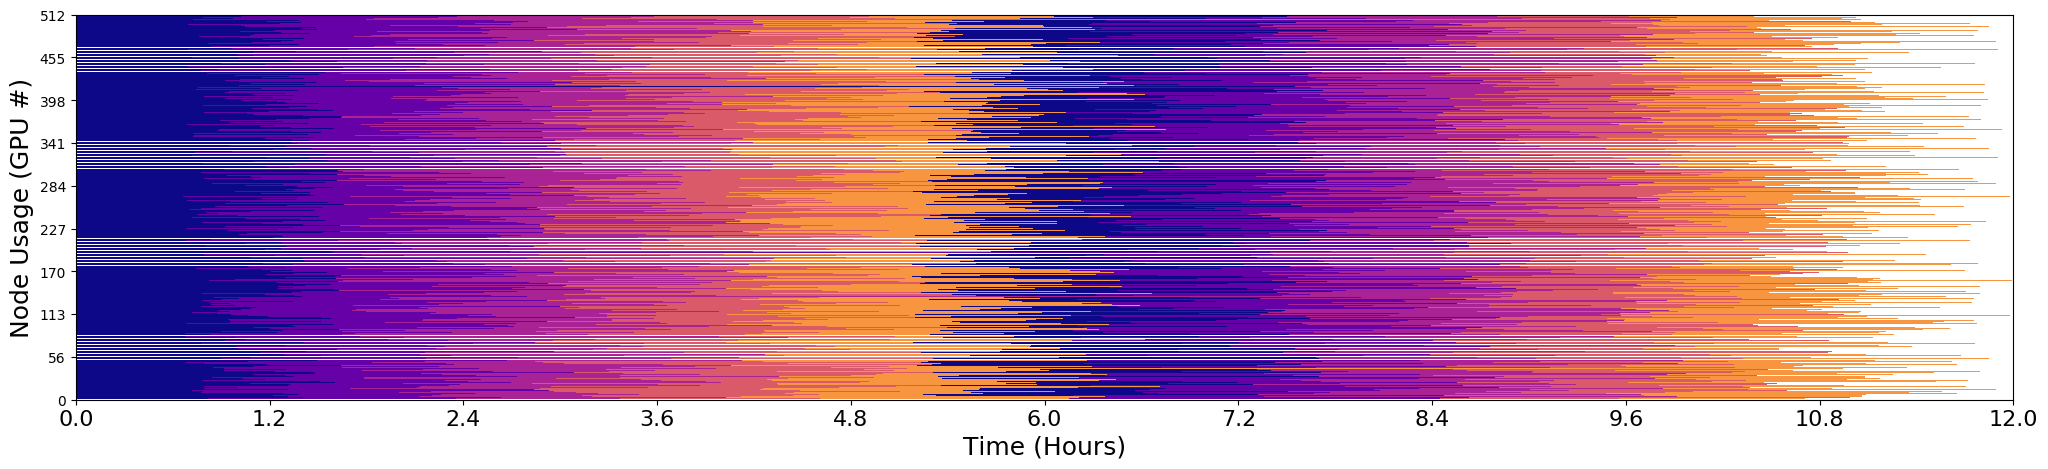
Profiling Multiple Experiments
In this example, we plot the execution timeline of a 512 workers (each executing Mirheo on a GPU) solving five different experiments simultaneously.
Profiling File: example_multiple_512Nodes.json
The image below shows in the y-axis the worker id, and in the x-axis the elapsed time. Colored lines show when a worker is active executing a model, with different colors corresponding to a different experiment. White segments indicate that the worker is idle, waiting for new samples to arrive.
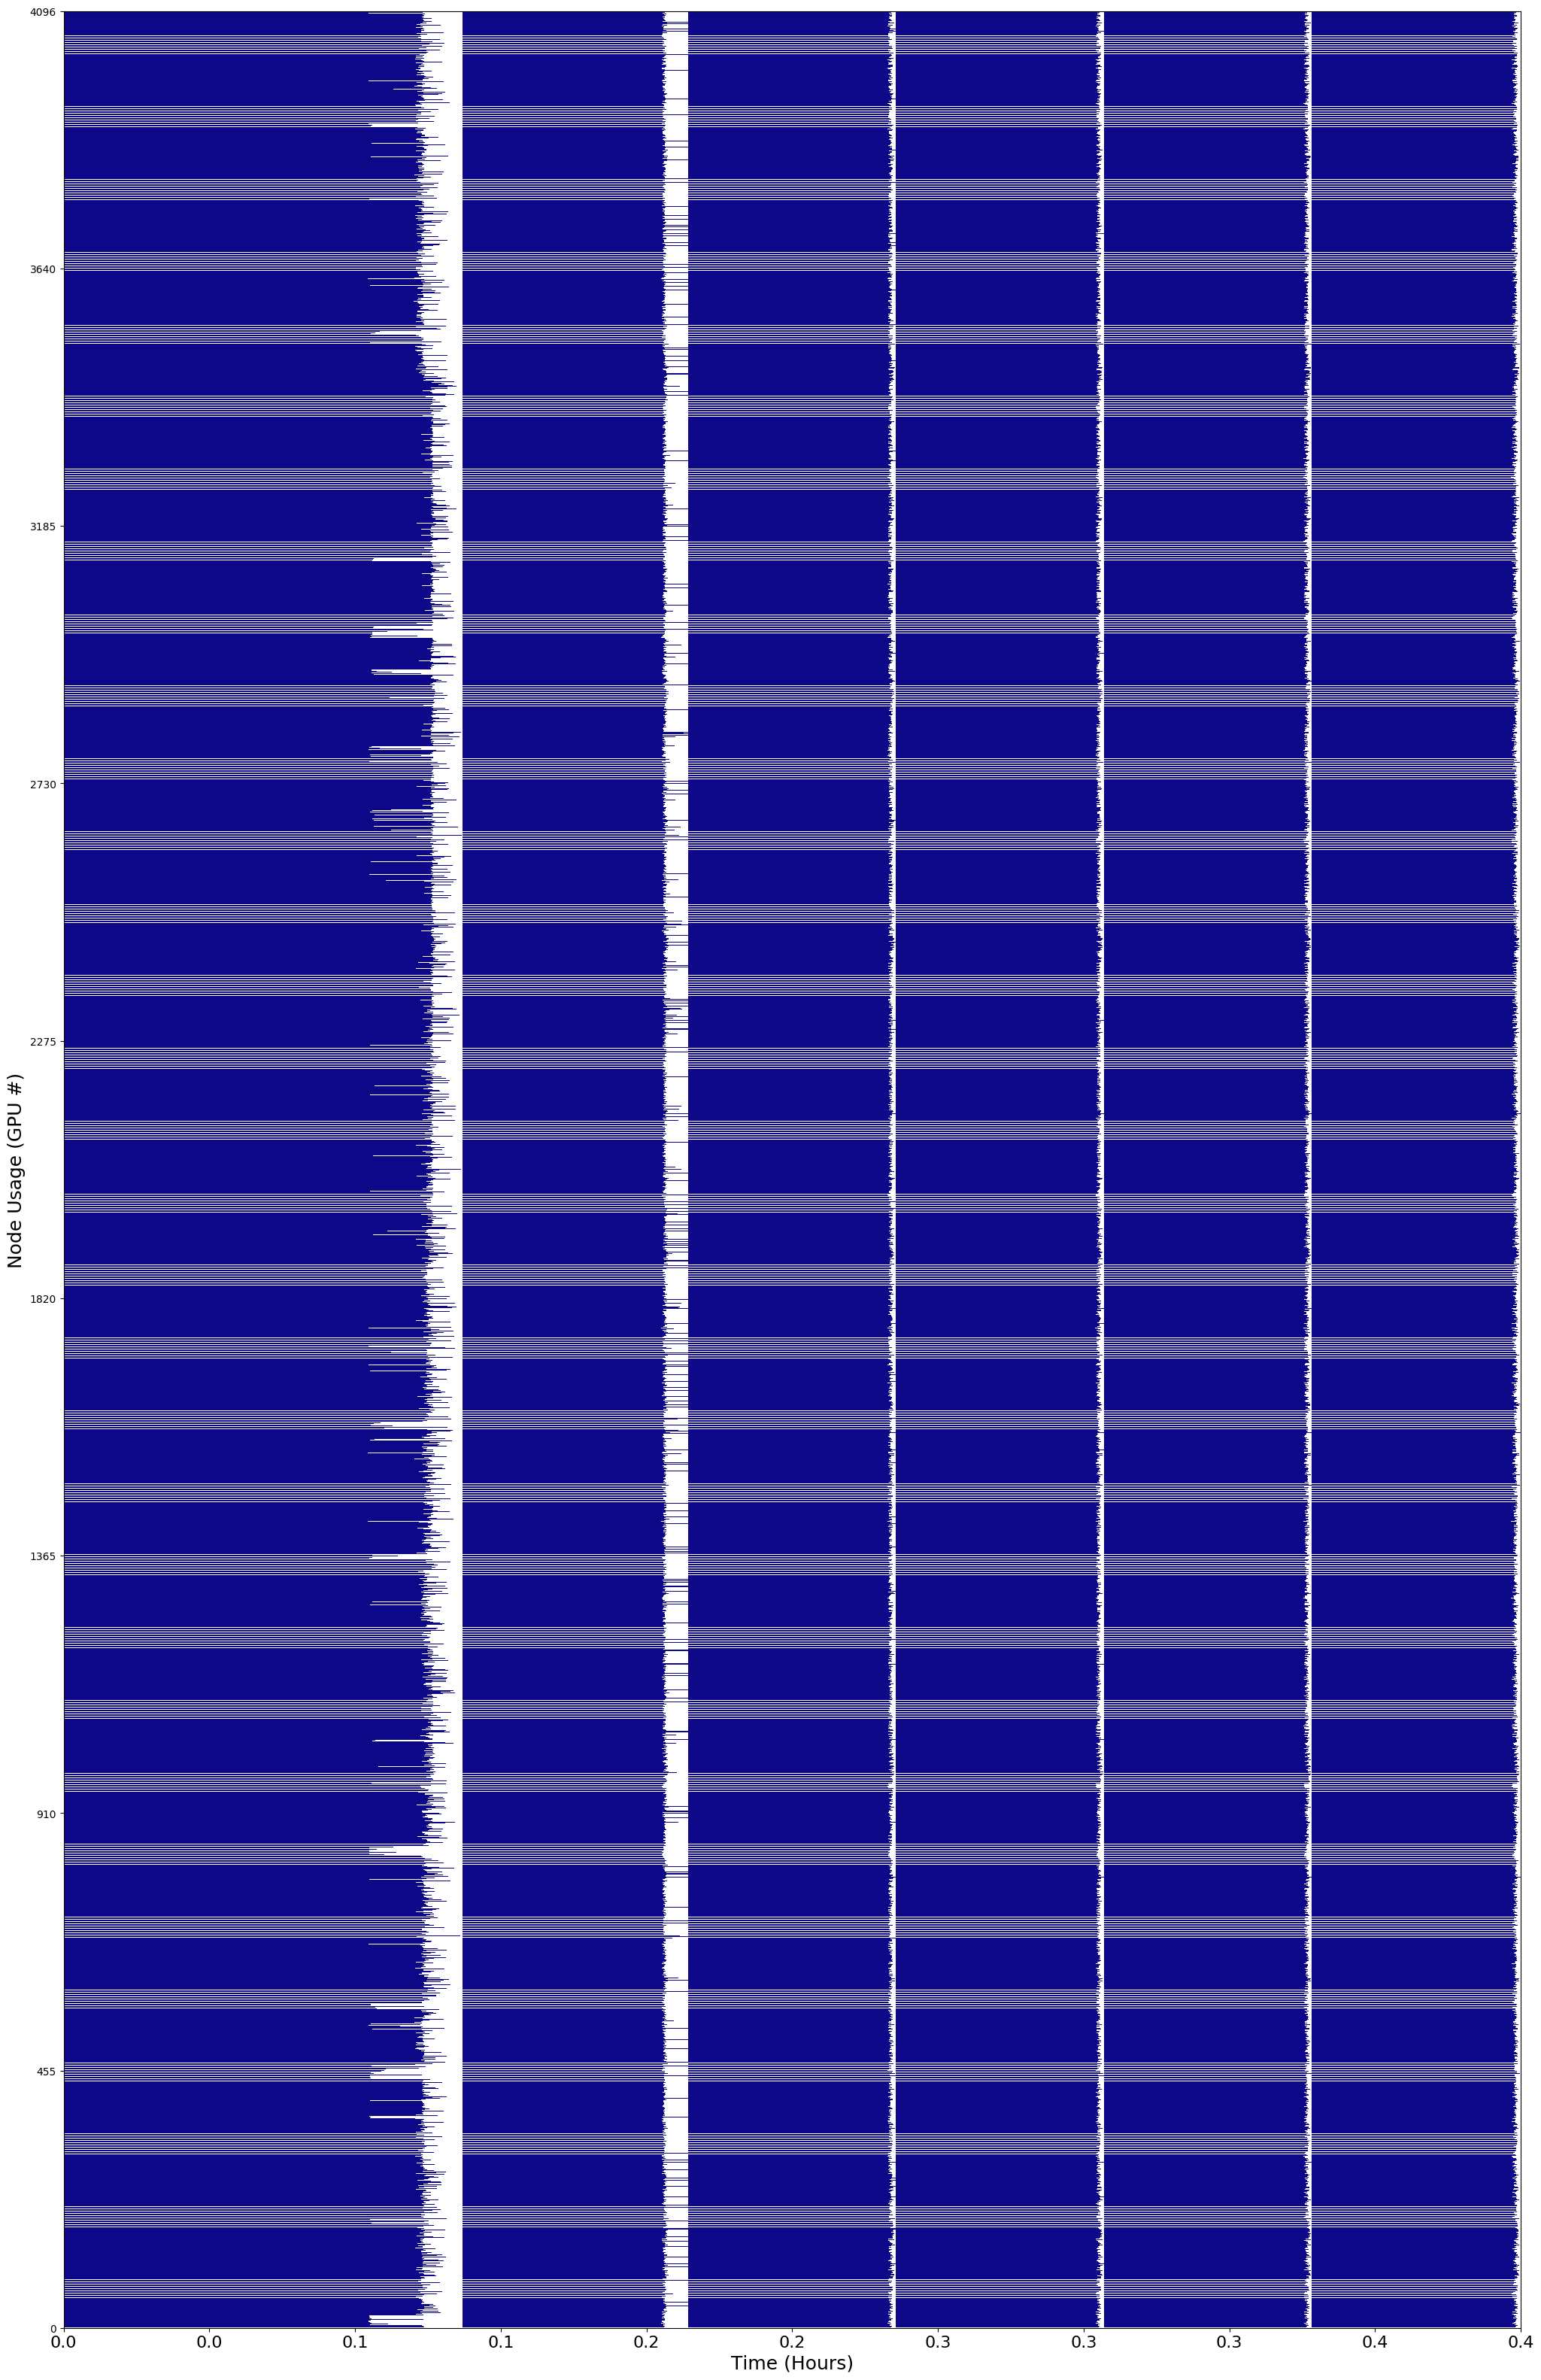
Profiling a Single Large-Experiment
In this example, we plot the execution timeline of a 4096 workers (each executing Mirheo on a GPU) solving a single experiment.
Profiling File: example_single_4096Nodes.json
In this case, since workers can only draw from a single experiment, they tend to spend more time idle. This is caused by load imbalance, when some samples require more time to finish, forcing others to wait until the next generation.